
Unleash the force within CRM Analytics
Are you ready to evolve beyond the limits of your Salesforce Joined Report Types. Only four report types or the visual mess, making it hard to sort through and analyze? Fear not, young padawan, for recipePro is here to unleash your inner Jedi and free you from the limits of joined reports.
CRM Analytics, makes it easy for you to connect and join many data sources with a few clicks. And then you can query and tie your data together all beautiful dashboard. And you can have 25 different joined data sources, that still has scalable peformance across large volumes of data.
1 – Use the Force – Convert your report types
The first step in your journey to is to bring in the report types you want to join into CRM Analytics. With recipePro, this is a simple process that can be done in just a few clicks.
- In App Launcher > Select “recipePro – App”
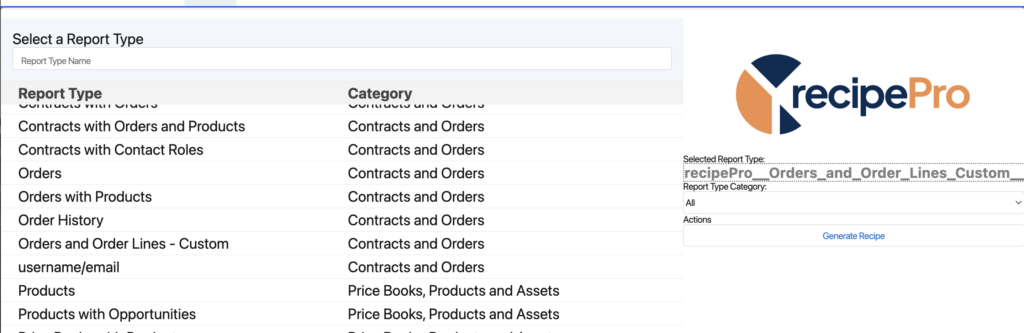
- Then select “recipePro” tab > recipePro will give you a search page with your entire orgs report types.
- 3 Step Conversion
- Search – Use search or toggle filters to find your report you want to generate recipe.q
- Select – Select the Report Type
- Send – Press “Send Recipe” and the data immediately we start to work it’s way to CRMA.
- Do the above for all of the report types you want to flatten into CRM-Analytics.
Once you have your report types imported, you can bring them all into the your dashboard
2 – Build your Dashboard:
Connect your Leads, Campaigns, Accounts, Opportunities, Support Cases, and Contracts all tied together by the account as a connected data source, and you’ll have a view of your business operations that would impress even the most powerful.
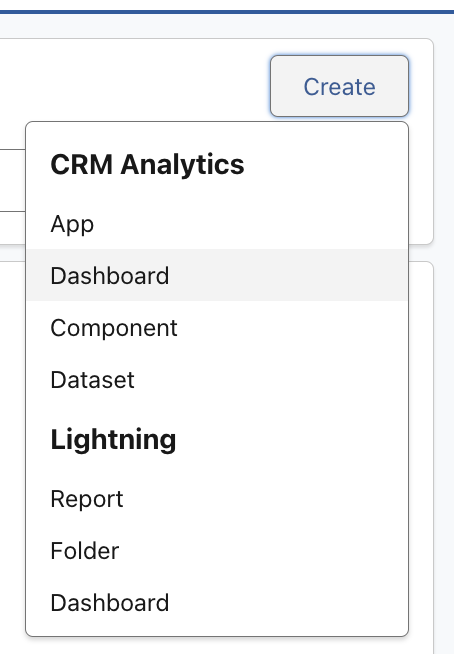
- In Analytics Studio
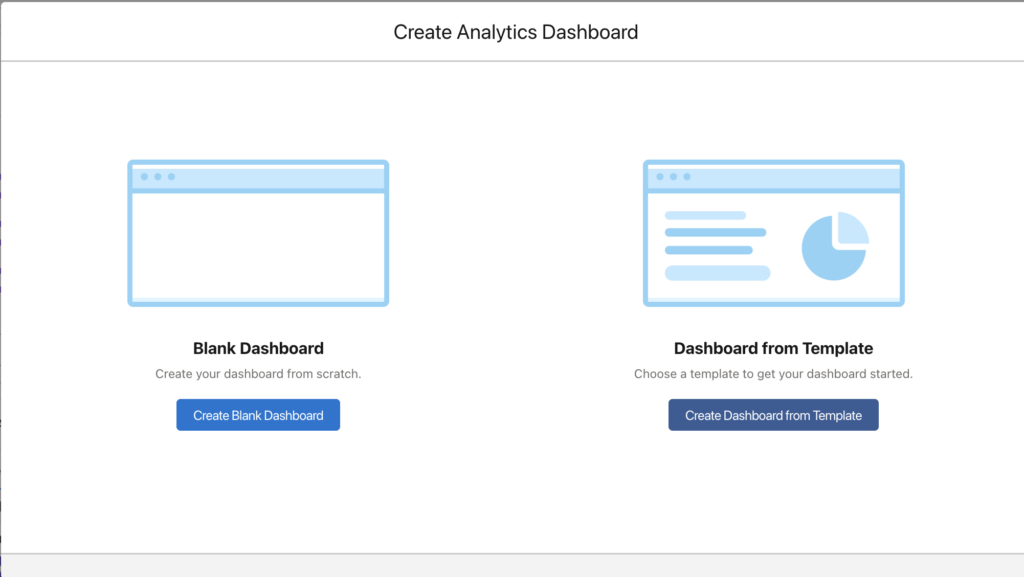
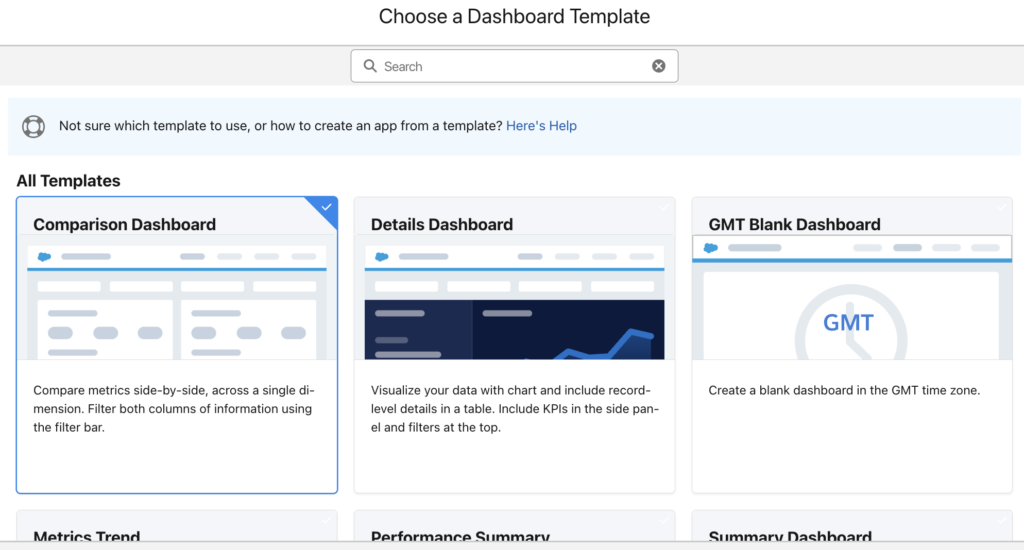
- Select “Create” > Select “Dashboard” > Select a “Template” or Start from a “Blank Dashboard”
- If blank dashboard – On the left hand side, drag in the chart and table widgets for each of the reports you brought in.
- Using a template – go to the next step.
- Click on Each Widget > Select the dataset generated from your reportType – name will be ‘recipePro__YOUR_REPORTTYPE_NAME’ > Confirm the metric / metrics you want on that chart.
- Repeat this until you have each chart filled filled.
Once you’ve build the visualizations you want, your data won’t be tied to one another, so to scale you will connect the data sources, and you will have the ability to see all your reports joined into a together experience.
3 – Connect Data Sources
- Click the Pencil “Edit” ✏️ button
- In the dashboard edit screen > Select the arrow “⬇️“ on the top right > select “Connect Data Sources”.
- Follow the prompts to connect to your desired data source.
- Select “New Connection” then add the datasets you want to join, ensuring you can select a field they all have in common.
- Click Choose First Data Source to select the first data source. For each data source, select a dataset or a custom query used in the dashboard.
- Choose one field from the data source so that CRM Analytics can match records between the specified sources.
- Click Choose Next Data Source to select the second source, and then choose a field.
- Do the above for any reportType you’ve brought in.
- If you are missing a field in one that you want to tie, edit your report type and run it recipePro report type sync from Part 1 Again.
- To add another data source, click Add Data Source. This option appears after you connect two data sources.You can connect two or more data sources.
- Click Save.
- Save your connection.
- Once connected, you can bring that field as a filter and it will update all the reports as joined reports.
Note that the specific steps may vary depending on your version of Tableau CRM and the data source you are connecting to.
May the KPIs be with You
And what about tracking key performance indicators (KPIs) for each Salesforce object? Here are some common KPIs for the Salesforce objects mentioned earlier:
- Campaigns: Count of Campaign Members, Count of Campaign Opportunities, Campaign Related Revenue
- Accounts & Contacts: Average revenue per account
- Opportunities: Total Closed Won Opps, Total Created Opps, Avg Opportunity Amount
- Support Cases: Average Case Duration, # Open Cases
- Contracts: Contract Value, Avg Contract Duration
Tracking these KPIs in your joined reports will give you valuable insights that will allow you to make data-driven decisions. You’ll have the power to adjust your marketing strategy, identify areas that need improvement, and ultimately rule your business operations like the Jedi master you were born to be.
Conclusion
So, my fellow CRM Analytics Data Engineering Jedi. Unleash your new found force. No more feeling limited to only four report types, no more struggling with a visual mess of data that’s hard to sort through. With recipePro, you’ll have the power to create bring in the report types into CRM Analytics – and join reports to your hearts content. The Force will be strong with you.